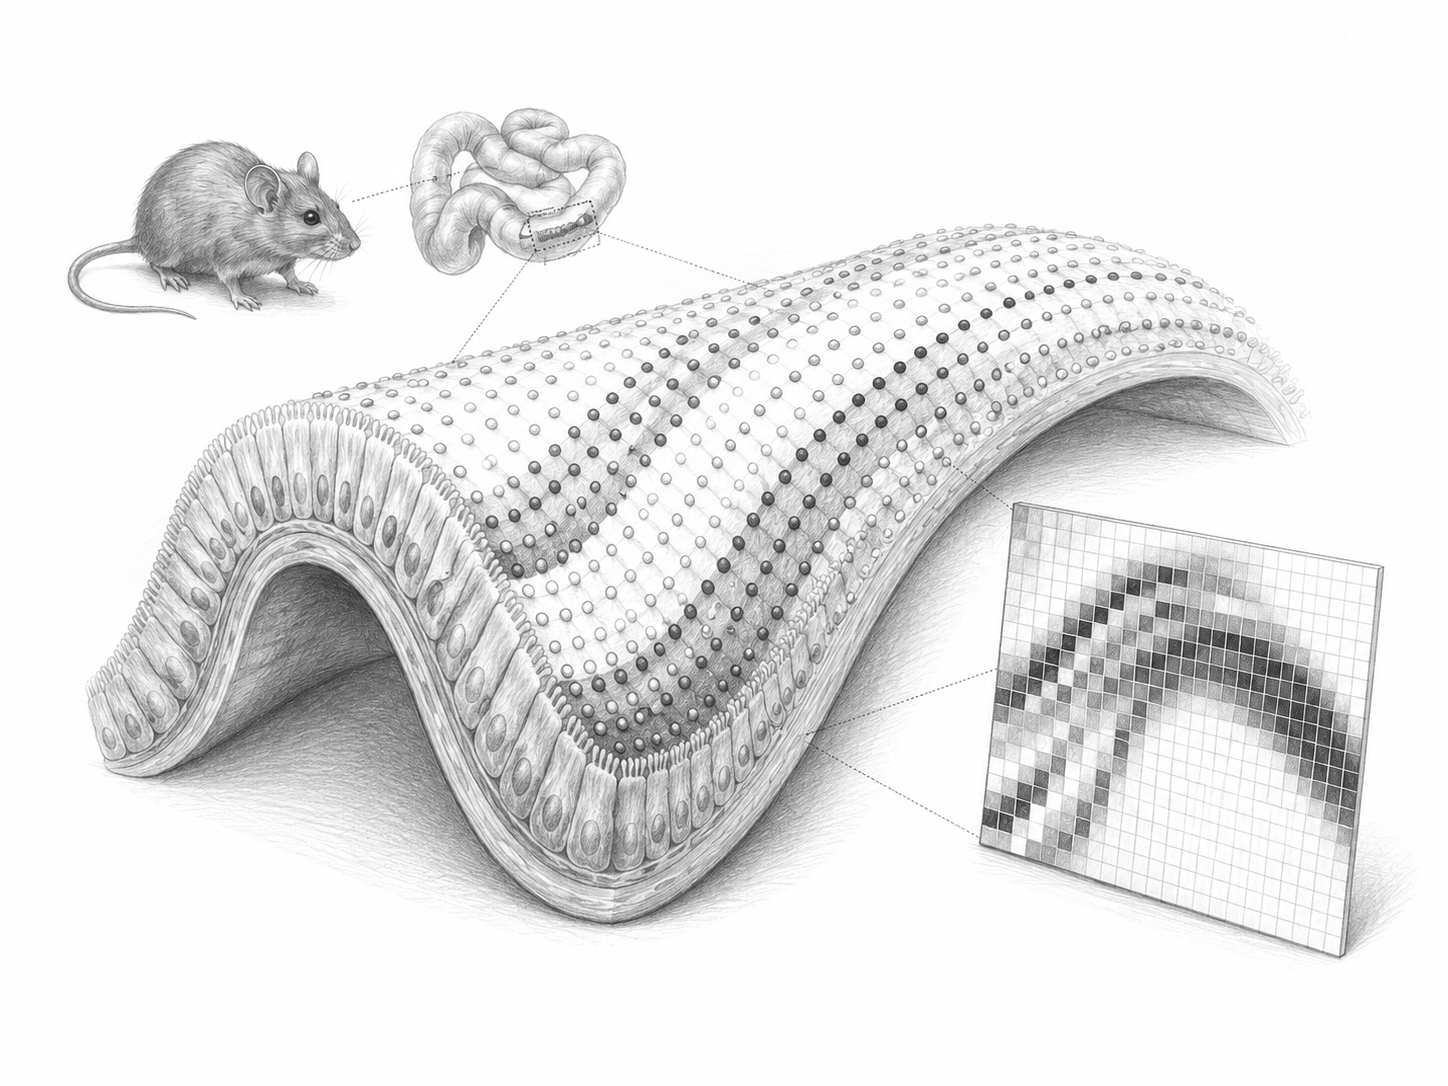
The lining of a mouse intestine is not a blob. It is a ribbon: a sheet of cells that curves and folds, with an inside edge and an outside edge, and a great deal of biology organized along that single direction. When a researcher slices it and measures which genes are switched on where, though, the data come back as a flat, two-dimensional scatter of coordinates, x and y, as if the tissue were a map rather than a folded band.
That mismatch is the problem Phillip Nicol, Rong Ma, Rosalind Xu, Jeffrey Moffitt, and Rafael Irizarry set out to fix in a preprint posted to bioRxiv on July 28. Their proposal, in essence: before asking which genes vary across space, work out what "space" actually means for the tissue in front of you.
The measurement technology at issue is spatial transcriptomics, which reads out gene expression while keeping track of where in the sample each reading came from. It has become a standard tool for questions like: within this one cell type, or this one region, are there genes whose activity shifts depending on position? Genes that pass that test are called spatially variable, and finding them is one of the routine goals of the field.
Existing methods generally hunt for those genes using the raw two-dimensional coordinates. The authors' objection is that the regions being examined are "often implicitly one-dimensional." A ribbon of gut lining has a natural along-the-ribbon axis. So does a layered structure in the brain. Treating those as generic two-dimensional point clouds throws away the organization that matters most, and the paper argues that this makes standard approaches less effective than they could be.
Fitting a curve, then reading along it
The team's answer comes in two parts. First they use spectral graph theory, a branch of mathematics that studies structure by treating data points as a network and examining its properties, to find a one-dimensional curve that closely approximates the sample's spatial coordinates. That curve becomes a new coordinate system. Instead of each cell having an x and a y, it now has a position along the tissue's own contour.
Second, they fit what statisticians call a generalized additive model, a flexible way of estimating a smooth trend without assuming in advance that it is a straight line or any other fixed shape. Applied along the new coordinate, the model estimates how each gene's expression rises and falls with position, and flags genes whose expression is not simply constant.
Two design choices distinguish it from common practice. The model works directly on gene counts, the actual number of molecules detected, so there is no need to normalize the data or transform it to make it look bell-shaped, steps that are standard elsewhere and that can distort what follows. And the output is not just a yes-or-no verdict. Because the method estimates the full expression pattern, the authors report that it also pinpoints the specific locations along the curve where expression departs from constant. A hypothesis test tells you a gene varies; this tells you where.
The authors validated the approach with extensive simulations, where the right answer is known by construction, and on real experimental data from more than one measurement platform, including Slide-seq and MERFISH. They report improved performance over existing hypothesis-testing approaches alongside the added ability to estimate patterns.
As a demonstration that the method can turn up biology rather than just statistics, they describe two findings. In mouse mucosa, the moist inner lining of organs like the gut, they identified previously undescribed subpopulations of cells related to interferon, a family of immune signaling molecules. And in a spatial dataset spanning multiple samples, they found markers of fibroblasts associated with inflammation. Fibroblasts are structural cells that build and maintain the scaffolding between other cells, and their behavior during inflammation is of active interest.
Why it matters
The appeal here is less about a single discovery than about what gets counted as a discovery at all. If a gene's expression pattern follows the shape of a tissue, and the analysis ignores that shape, the pattern can wash out into noise. Fixing the coordinate system does not add data; it changes what the same data can show.
The pinpointing matters too. Knowing that a gene varies somewhere in a tissue is a weaker claim than knowing it turns on at a particular depth in a layered structure. The second version is the kind of statement that suggests a follow-up experiment.
Some caution is warranted. This is a preprint, meaning it has not yet completed peer review, and it is a methods paper: the central claim is that a tool works better, which the field will test by using it. The biological findings, the interferon-related subpopulations, the inflammation-associated fibroblast markers, are presented as illustrations of the method's usefulness, in mouse and in existing datasets, not as fully worked-out biology. The mouse results in particular are a starting point rather than a conclusion about humans.
One of the authors, Jeffrey Moffitt, discloses that he is a founder of, stakeholder in, and adviser to Vizgen, a company in this measurement space, and an inventor on related patent applications; his institutions state those interests are managed under their conflict-of-interest policies. The work was funded by the National Institutes of Health.