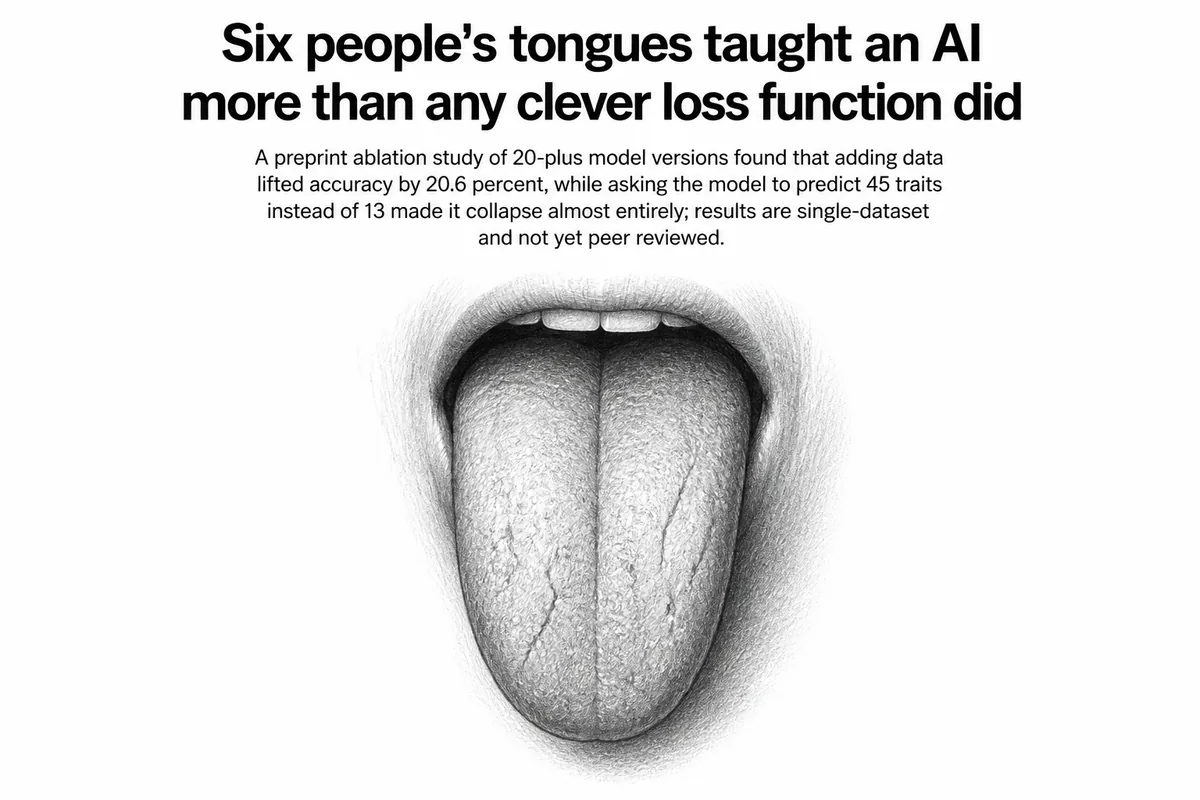
The number that stops you is 0.22. That is the weighted-F1 score, a measure of classification accuracy where 1.0 is perfect, that a tongue-diagnosis model fell to when its designers asked it to predict 45 different tongue traits instead of 13. At 13 labels the same setup scored 0.78. The authors call the drop a catastrophic collapse, and it is the sharpest finding in a study otherwise made of careful, incremental comparisons.
Longxia Gao, Linan Wang, Yuhe Han, Junze Geng, Meng Zhang and Hanqing Zhao ran the comparisons. In traditional Chinese medicine, a practitioner reads the tongue: its color, its coating, its shape, the texture of its surface. Those readings feed into a diagnosis. Plenty of research groups have tried to automate the step with deep learning, and plenty have reported that it works. What nobody had done systematically, the team argues, is establish which parts of the design actually carry the weight.
So they built more than twenty versions of the same system and measured each one under five-fold cross-validation, a procedure that splits the data five ways and tests on each slice in turn so a lucky split cannot flatter the score. They worked with TongueDx2, a set of 5,109 tongue images of which 976 carry expert annotations, and with a merged collection of 11,101 samples. Across those datasets they swapped in six different backbone architectures (the underlying image-recognition network), four loss functions (the formula that tells the model how wrong it was), five ways of augmenting the training images, and six training strategies.
What actually moved the needle
More data, mostly. Going from the 976 expert-annotated images to the 11,101-sample set lifted weighted-F1 from 0.6625 to 0.7761, an improvement the authors put at 20.6 percent. No architectural choice came close. The best small-data model used ConvNeXt-Tiny, a compact convolutional network the team singles out for getting the most performance per parameter, paired with restrained image augmentation and a technique they call weak-group ensemble replacement.
That last one is worth a sentence. The usual way to combine several models is to average their predicted probabilities. Instead, the team let a specialist model take over the labels that the main model handled poorly, which bought them 2.1 percent over averaging.
The augmentation result is the one a practitioner might have predicted. Training-image augmentation means feeding the model distorted copies of each photo so it learns to ignore irrelevant variation. Shift the colors around, though, and you are destroying the signal itself, because tongue color is the diagnosis. Restrained color augmentation, the authors report, is critical.
One more comparison went against fashion. Asymmetric Loss was designed for exactly this kind of problem, multi-label classification where some labels are far rarer than others. Plain binary cross-entropy, the older and simpler choice, beat it by 2.7 percent.
Why it matters
The honest reading of this paper is that it is a corrective rather than a breakthrough. Its most useful contribution is negative: a catalogue of choices that sound sophisticated and do not help, next to the one boring thing that does.
The 45-label collapse is the part with consequences beyond tongue diagnosis. A clinician's vocabulary is fine-grained, and the temptation when building a diagnostic tool is to capture all of it. This study suggests that fineness has a price the data may not be able to pay, at least at these sample sizes: stretch the label set past what your annotations can support and the model does not degrade gracefully, it falls apart. The authors expect their six principles to carry over to other multi-label medical imaging problems with imbalanced classes, though they demonstrate them only here.
What the paper does not do is worth stating plainly. It does not test whether any of these models agree with human practitioners in a clinic, or whether tongue diagnosis predicts anything about a patient's health. It measures how well a model reproduces the labels in a particular dataset, and the top score, 0.7761, leaves substantial room for disagreement. The work is a preprint on arXiv, so it has not passed peer review, and every number comes from one image collection and its merged extension. A second dataset from different cameras, different lighting, different annotators could tell a different story.
Still, there is something clarifying about a paper whose headline result is that the fanciest knob was not the important one. Most of the field's effort goes into architectures and loss functions. This team checked, and found the data was doing the work.