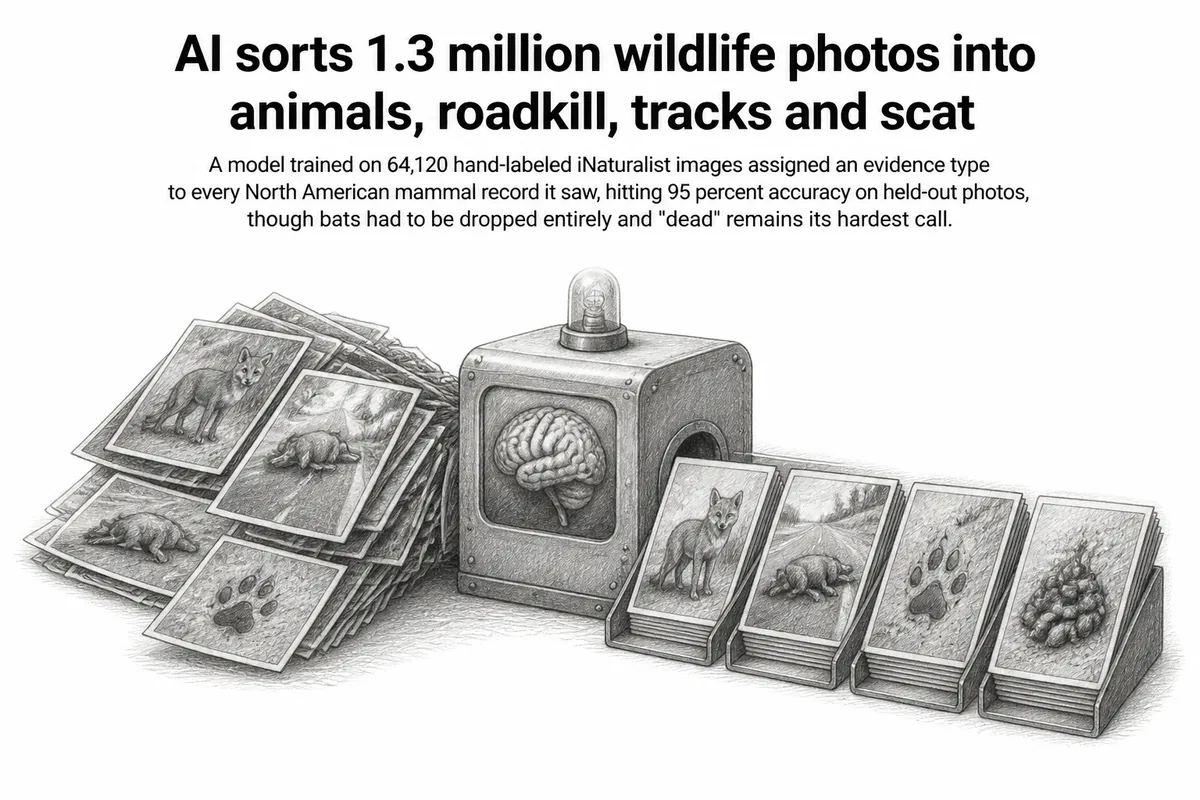
Photographs of shrews and moles on iNaturalist are mostly photographs of dead shrews and moles. In the new dataset assembled by Mohammad Alyetama, Alex Jensen and their colleagues, 84.9 percent of observations in the order Eulipotyphla show a dead animal. Primates, at the other end, are 99.3 percent alive. That gap is not a fact about how many shrews there are. It is a fact about how people encounter them, and until now it was invisible in the data.
iNaturalist is the largest source of citizen-collected mammal records in the world, with more than 5 million Research Grade observations as of January 2026. Research Grade means the record carries a photo or audio clip and that at least two-thirds of the community identifiers agree on the species. What it does not mean is that the photo shows a living animal. It might be roadkill. It might be a footprint in snow, a pile of scat, a beaver's chew marks on a stump, or an armadillo burrow.
That distinction matters more than it first appears. iNaturalist has no sampling protocol: people upload what they happen to see, wherever they happen to be. Different evidence types follow different geographies of effort. Dead animals turn up where there are roads. Tracks turn up where the ground holds a print, which means snow and mud. The authors point out that a model looking at reports of gray wolves without accounting for this could conclude wolves are denser in snowy regions when what is really denser there is the chance of spotting and photographing a wolf print.
iNaturalist does let users tag observations with annotations like "dead" or "tracks," but most records go untagged. The team measured how sparse this is. Among 2,000 observations their model called scat, only 28.1 percent carried a matching scat annotation on the platform. For tracks it was 34.3 percent, for dead animals 44.6 percent. Live animals were the least annotated of all, at 12.3 percent, presumably because a living animal is the unremarkable default nobody bothers to mark.
How they built it
The fix was a straightforward piece of machine vision. Six researchers, working mostly out of the North Carolina Museum of Natural Sciences and NC State, downloaded North American mammal observations whose photos carried an open license, then sat down with an annotation tool and hand-labeled 64,120 images: 22,301 live animals, 24,105 dead ones, 9,193 tracks, 4,077 scat and 4,344 other sign. Because scat and other sign are rare in a random sample, they deliberately went hunting for them, pulling from a community project called the North American Animal Tracks Database and topping up with species known for leaving distinctive marks: pocket gopher mounds, black bear scratches, woodrat stick nests, deer rubs.
Eighty percent of those labels trained a YOLOv8 image classifier, a widely used off-the-shelf vision model, on a single consumer graphics card. The remaining 20 percent tested it. Top-1 accuracy, meaning the share of images where the model's first guess was right, came to 95.01 percent. They then ran it across 1,326,100 observations and published the results as a spreadsheet on Zenodo, with the model itself on Hugging Face and GitHub.
Across the full dataset, 85.0 percent of observations came out as live animals, 7.3 percent dead, 4.1 percent tracks, 1.9 percent other sign and 1.6 percent scat.
The honest part of the paper is where it says what broke. Live versus dead was the model's weak spot, confused about 4 percent of the time in each direction, and for a reason that is hard to engineer away: opossums play dead, and small mammals held in a researcher's hand for study go limp in a way that looks a lot like death. Bats were so consistently misread this way that the team excluded the entire order from both training and the released dataset. Shed antlers were filed under "dead" even though the deer that dropped them is presumably fine. And because only each observation's first photo was classified, a record containing both a track photo and a scat photo gets sorted by whichever came first.
Why it matters
This is infrastructure, not a discovery. Nobody learned a new thing about wolves here. What changed is that a million-record dataset ecologists already lean on now carries a column it was missing, so a researcher can exclude scat records from an analysis that cannot tolerate false positives, or model track reports and roadkill reports as the separate sampling processes they actually are.
The authors are careful about the reach of their own explanations. The shrew pattern probably reflects house cats bringing in kills, and the rodent "other sign" rate probably reflects beaver chew marks, but they present these as hypotheses for someone else to test, not conclusions. They also recommend that anyone using the file filter by the confidence score attached to each row, and check whether their results survive a change in that threshold. Roughly 95.9 percent of classifications came with a top score of at least 0.9.
The machine labels are not vetted by any human, they use a coarser vocabulary than iNaturalist's own annotation system, and they cover only openly licensed photos. What they offer instead is consistency: one definition, applied the same way, to every record. The authors imagine the eventual answer looks like iNaturalist's species identification already does, with the model proposing and the community correcting.