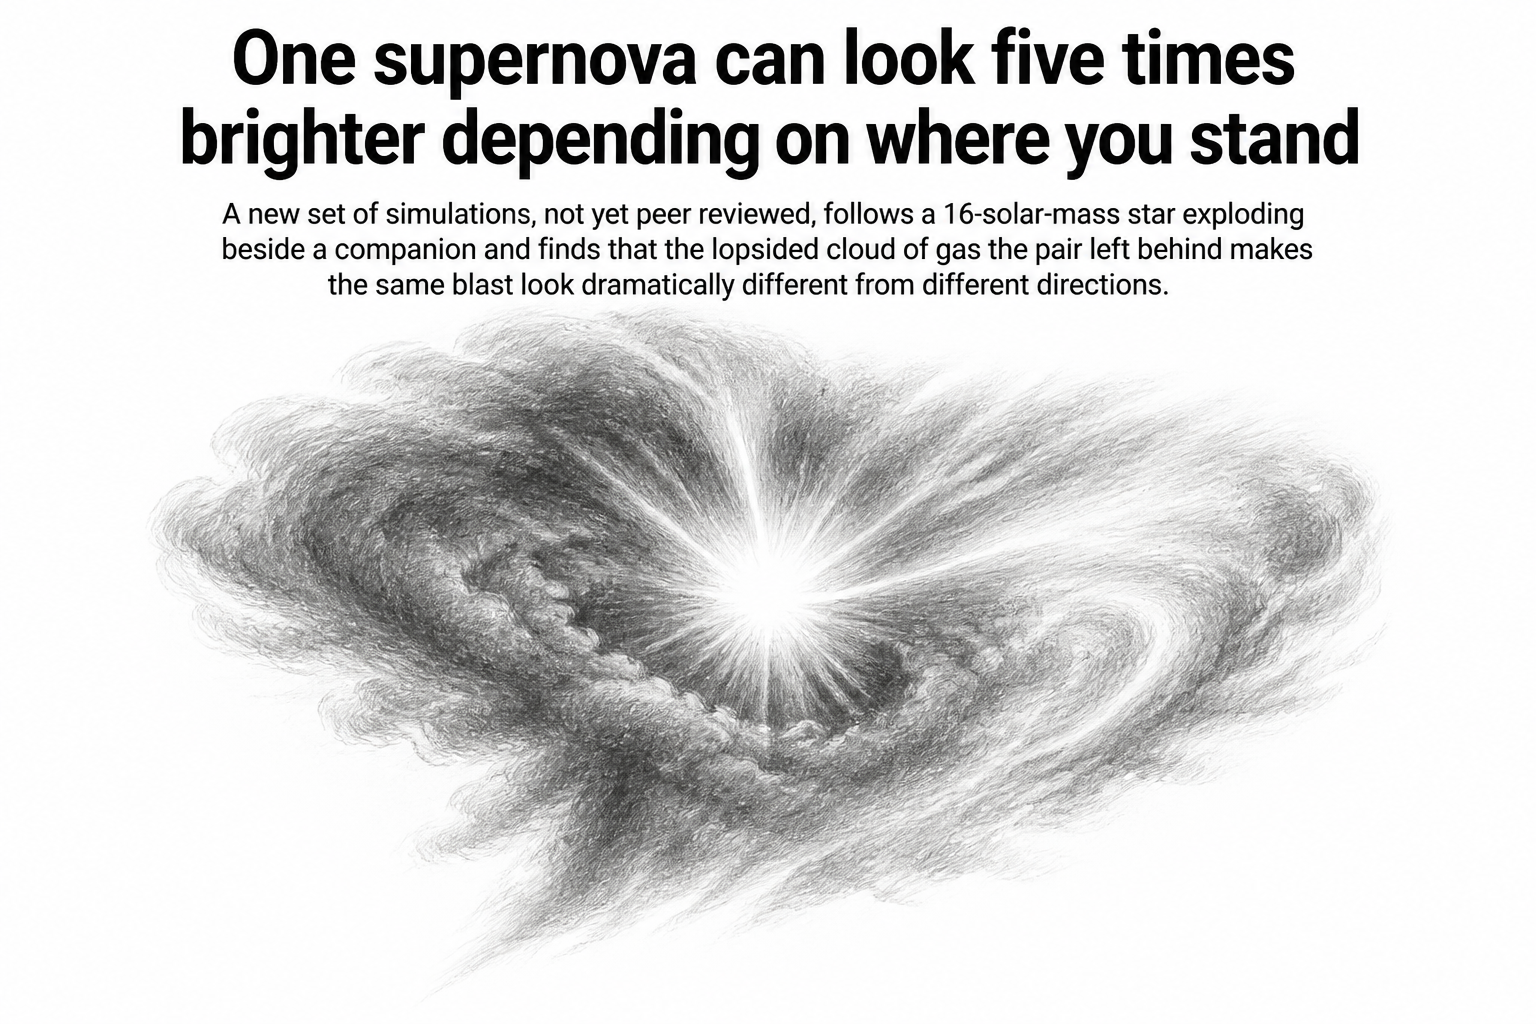
Take one exploding star. Watch it from three directions. In the simulations Soham Mandal and colleagues ran, the peak brightness changes by a factor of about five, and the color of the fading light shifts by roughly 1.5 magnitudes in the late stages. Nothing about the explosion itself changed. Only the observer's address did.
The reason is the mess a star leaves around itself before it dies. Massive stars shed gas for hundreds of thousands of years before their cores collapse, and that shed material, called circumstellar material, sits waiting when the blast wave arrives. The collision between the fast-moving debris and this surrounding gas is what makes many supernovae shine as brightly and as long as they do. Where the gas is thick, the crash is violent and the light is bright. Where it is thin, the explosion has less to slam into.
Most of the tools astronomers use to interpret these events assume the gas sits in a neat sphere, blown outward evenly by a lone star. That assumption is convenient. It is also, the authors argue, frequently wrong, because most stars massive enough to end as core-collapse supernovae have a companion.
What the team modeled
Mandal's group built a suite of binary star systems using MESA, a widely used stellar evolution code. They fixed the primary star, the one destined to explode, at 16 times the mass of the Sun. They varied the companion between 12 and 15 solar masses, and set the pairs on wide orbits with initial periods longer than 500 days. In each case the primary swells until its outer layers spill past the gravitational boundary that holds them, a process called stable Roche lobe overflow, and gas streams toward the companion and out into space.
That is where the geometry comes in. A single star's wind drifts outward more or less evenly. A binary is a spinning system, and gas leaving it gets stirred into spirals, disks, and dense equatorial belts by the orbital motion. The team took the mass-loss histories from their MESA models, combined them with the orbital dynamics, and built three-dimensional maps of the resulting clouds. The shapes they found were strongly aspherical, and the specific shape depended on two things: how long the orbit took, and the ratio of the two stars' masses.
Then they exploded the star. Along three different lines of sight through each cloud, they pulled out the density of gas the blast wave would encounter, and fed those profiles into Stella, a radiation-hydrodynamics code that computes how bright a supernova appears in different filters over time. Three viewing angles, three very different light curves.
The bias problem
The practical consequence is uncomfortable. When astronomers see an interacting supernova, they typically fit its light curve with a one-dimensional model that assumes a lone star and a spherical wind, and read off numbers: how much energy the explosion released, how much material was ejected, how fast the star had been losing mass beforehand.
Mandal and colleagues ran that exercise on their own simulated supernovae, where the true answers were known. The one-dimensional fits were off by up to 50 percent for explosion properties. For inferred mass-loss rates, the errors exceeded 200 percent. A factor of three, in other words, on a quantity that feeds directly into how astronomers understand the last years of a massive star's life.
Why it matters
Interacting Type II supernovae are a famously varied family. Some brighten fast and fade fast, some stay luminous for months, some show colors that resist easy explanation. The standard instinct is to attribute that spread to real physical differences: different progenitor masses, different explosion energies, different amounts of shed gas.
This work suggests a chunk of the variety might be an illusion of perspective. Identical binary systems, exploding in identical ways, could populate a wide swath of the observed distribution simply because we catch them from different angles. The authors put it carefully: their results are consistent with a substantial fraction of interacting Type II diversity arising from binary-shaped asymmetric gas and viewing-angle effects. They do not claim it accounts for all of it.
The caveats are worth holding onto. This is a modeling study, not an observation, and it is a preprint submitted to AAS journals but not yet through peer review. The parameter space is narrow by design: one primary mass, a small range of companions, wide orbits only. Three lines of sight per model is a sparse sampling of a three-dimensional cloud. Whether the same factor-of-five spread holds for closer binaries or different mass combinations is an open question the paper does not answer.
Still, the direction of the argument is clear enough. If the gas around dying stars is genuinely lopsided, and if a large share of massive stars die with a companion nearby, then the spherical models doing most of the interpretive work in this field are measuring something other than what they claim to measure. The fix the authors call for is not subtle: build the multidimensional models, and account for where the telescope happens to be pointing.