Take a sequence of three numbers and throw away almost everything about them. Keep only the ranking: which came first, second, third. That is what an ordinal pattern is, and for two decades it has been one of the more useful tricks in time series analysis, because rankings survive noise, drift, and rescaling in a way raw values do not. The cost has always seemed obvious. If you keep only the order, you throw away the size, and so ordinal methods were understood to be blind to a signal's amplitude distribution: whether its fluctuations are gentle and bell-shaped, or dominated by rare enormous jumps.
Alberto Mateos Roig, Luciano Zunino and Felipe Olivares argue in a new arXiv preprint that the blindness is not fundamental. It is an artifact of where you look. Rank the original data and yes, the amplitudes vanish. Rank the running sum of the data, the random walk it traces out, and the amplitudes come back.
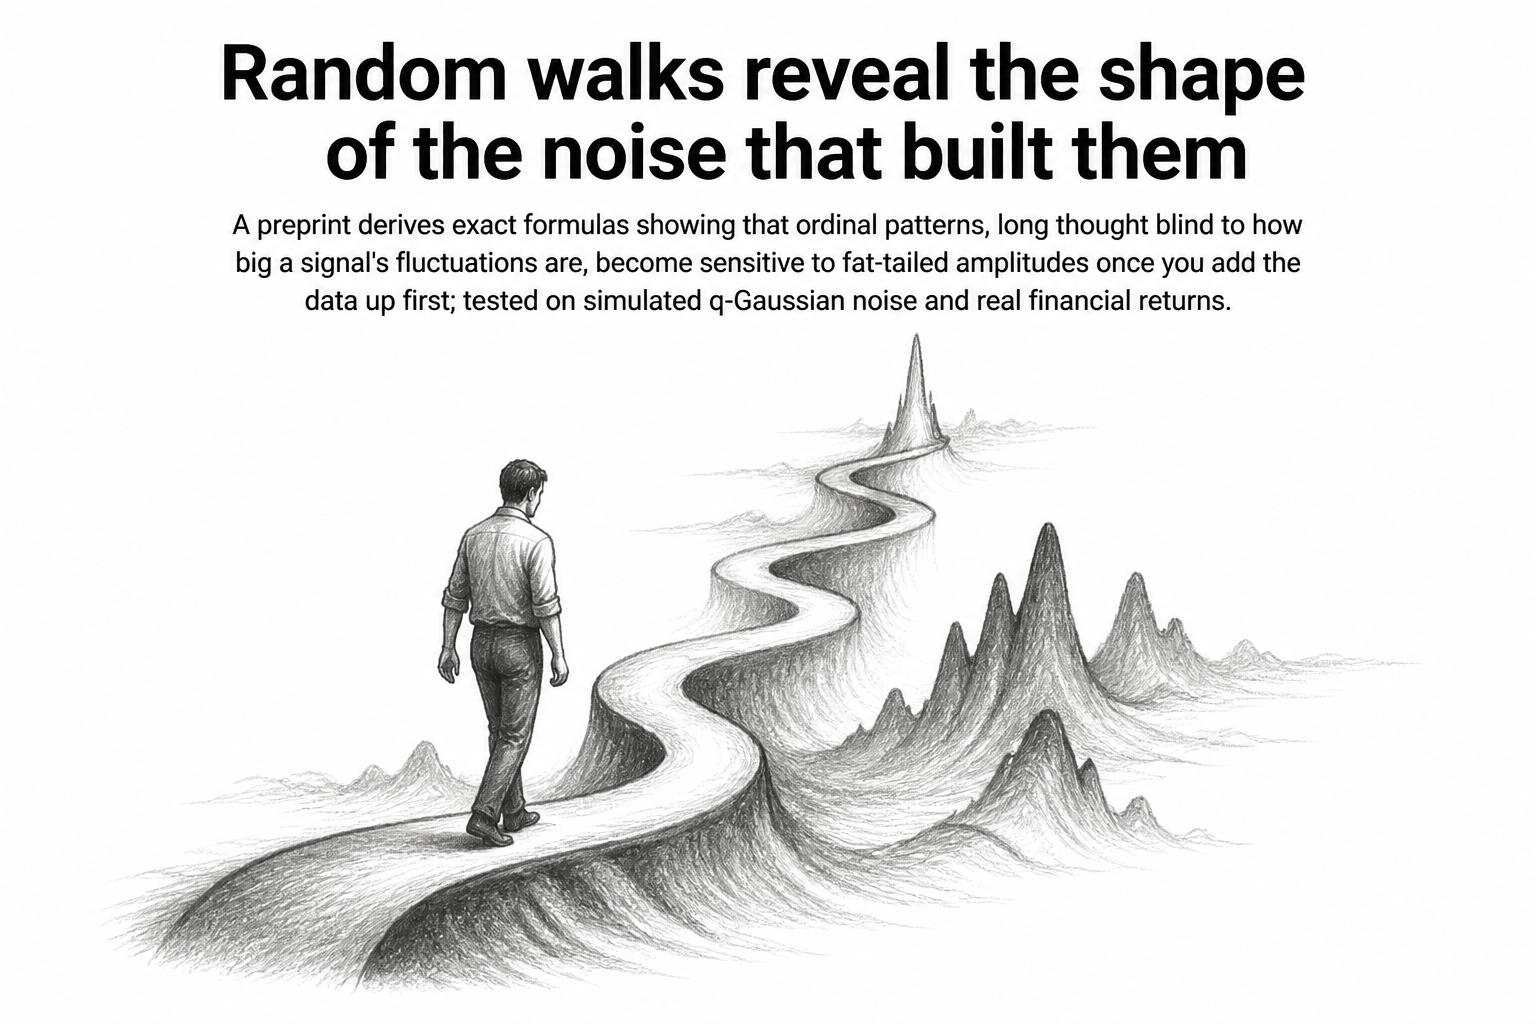
The intuition is worth sitting with. A random walk is what you get when you start at zero and add each new fluctuation to your running position. The walk's path does not just record the order of the steps; it records how far each one carried you. A single huge step reshapes the local geometry of the path in a way that changes which future points end up above or below which others. The ordering of the integrated series, in other words, quietly encodes the sizes of the increments that produced it.
What they actually did
The team worked out the mathematics for random walks built from independent non-Gaussian increments, deriving analytical expressions for how often each ordinal pattern should appear. Two things fell out. For symmetric increment distributions, some pattern probabilities are pinned entirely by symmetry: no matter what the underlying distribution looks like, those numbers are fixed. The remaining patterns are the informative ones. Their probabilities depend explicitly on the shape of the increment distribution, which is precisely the amplitude information ordinal methods were supposed to have discarded.
To check the algebra, the authors ran numerical simulations using q-Gaussian increments, a family of distributions with a tunable parameter that stretches a Gaussian bell into progressively heavier tails. The simulated pattern frequencies matched the theoretical predictions.
One finding reads as a practical warning rather than a theoretical result. How you build the random walk matters. Different centering procedures, meaning different choices about what baseline you subtract before summing, can significantly change the resulting ordinal statistics. Get that step wrong and the non-Gaussian signature you were trying to measure can be distorted. The authors treat this as fundamental to accurate characterization, not a footnote.
Finally they took the framework to real data: financial time series, specifically the integrated logarithmic returns of markets. The ordinal distributions there captured non-Gaussian features the authors describe as consistent with a cubic law, a known empirical regularity in the tails of financial return distributions. That is a validation on messy real-world data rather than a new claim about markets.
Why it matters
Most of the appeal of ordinal analysis has been its robustness. It is fast, it needs no assumptions about the underlying distribution, and it survives the monotonic transformations and calibration drift that plague real measurements. The tradeoff was that you had to reach for a different set of tools whenever amplitude was the thing you cared about, and heavy tails are very often the thing you care about, in finance, in geophysics, in physiological recordings.
What this preprint offers is a way to get both from the same machinery. Integrate first, then rank, and the ordinal statistics carry information about how extreme the fluctuations are. Because the authors derived closed-form expressions rather than just observing the effect empirically, the pattern frequencies become something you can compare against a prediction, not merely a fingerprint to match.
The honest limits are worth stating. This is a preprint at eleven pages with five figures, not yet peer reviewed. The analytical results are derived for independent increments, which is a strong assumption that real signals with memory or correlation will violate. The financial validation demonstrates that the method detects known non-Gaussian structure; it is a proof that the tool works on real data, not evidence about market behavior that was not already understood. And the sensitivity to centering choices means anyone applying this needs to be careful about a step that might otherwise look like bookkeeping.
Still, the conceptual move is a clean one. A limitation that had been treated as inherent to a whole class of methods turns out to depend on which version of the data you feed them. The information was never destroyed. It had just moved.