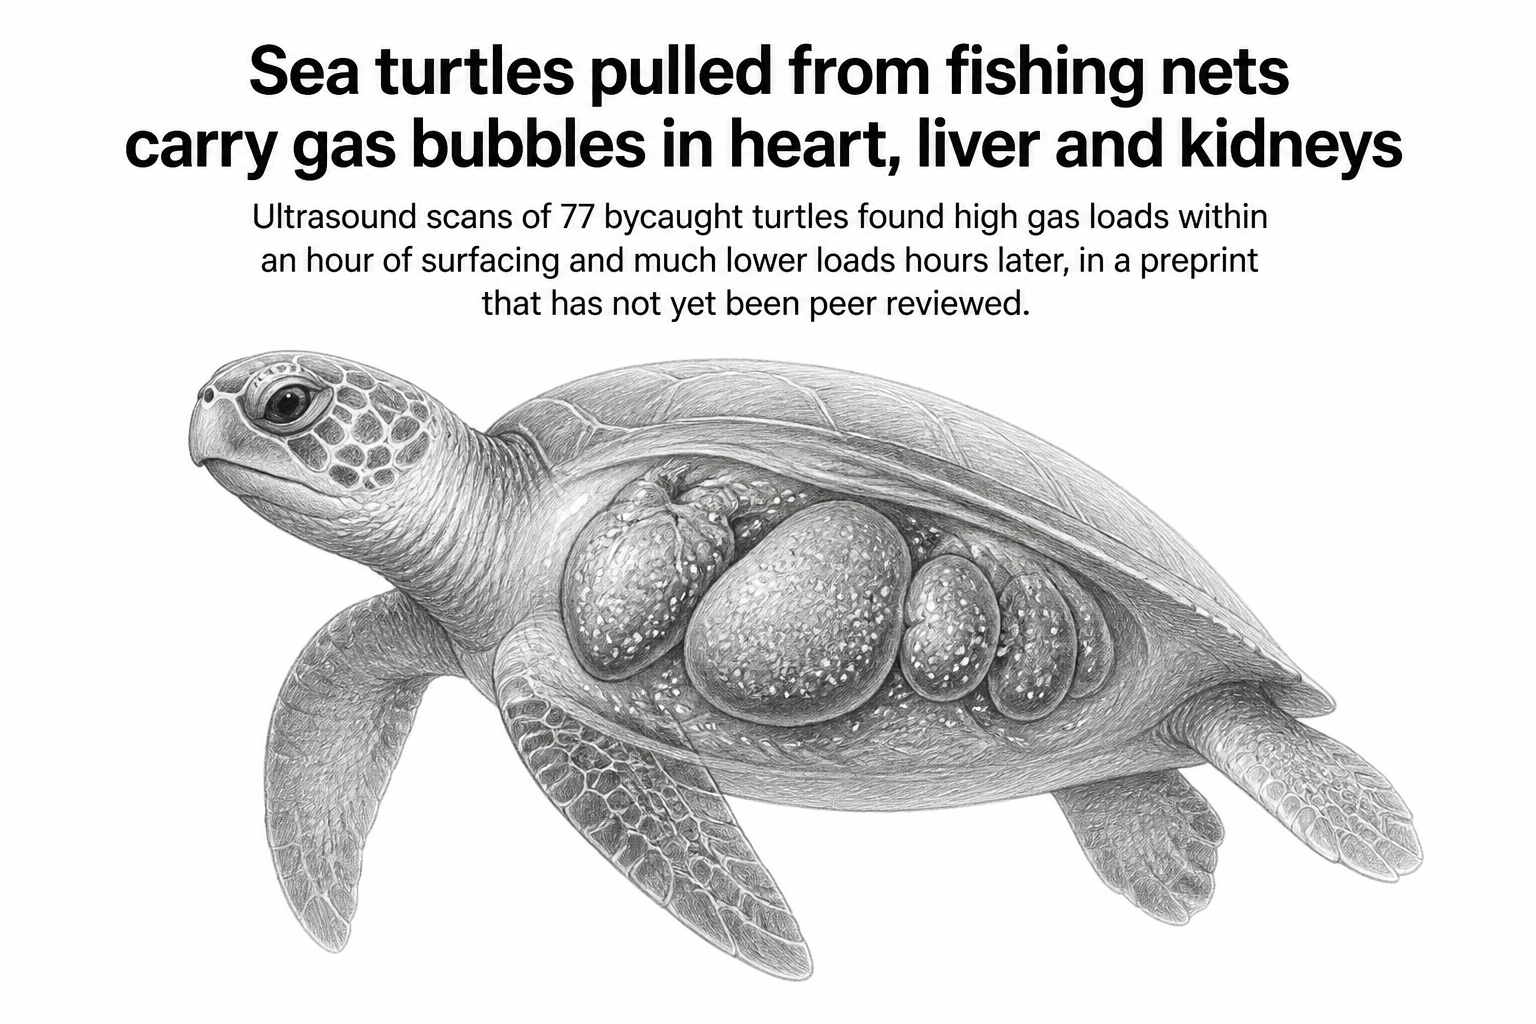
Fifty-four minutes. That is the average gap between a sea turtle surfacing in a fishing net and a veterinarian pressing an ultrasound probe against its body on the deck of the boat. In those scans, the median gas grade in the liver, kidney and heart was 3 on a scale that runs from 0 (no gas visible) to 5 (so much gas that the organ's anatomy disappears behind it). Turtles scanned at shore-based facilities, a mean of 330 minutes after surfacing, looked very different: median grades of 1, 1 and 0.
That contrast sits at the center of a new preprint from Katherine Eltz, Virginie Papadopoulou and colleagues at the University of North Carolina at Chapel Hill, the Fundacion Oceanografic de la Comunitat Valenciana and Linkoping University. The team examined ultrasound images from 77 turtles caught incidentally in fishing gear, 47 scanned onboard vessels and 30 scanned later on land, and asked whether a computer could read gas burden out of the images rather than relying only on a clinician's eye.
The underlying problem is a form of decompression sickness. A sea turtle held underwater in a net cannot surface to breathe, and the physiology of that forced submersion can leave dissolved gas coming out of solution as bubbles once the animal is brought up. Divers know the condition as the bends. In turtles it can be severe enough to kill, and the gas shows up on ultrasound as bright specks and streaks where there should be smooth tissue.
Reading the noise, not just the picture
Grading gas by eye works, but it depends on the person holding the probe. So the researchers also pulled numbers directly from the pixels. The simplest measure was mean brightness inside a region of interest. In the heart and liver, brightness climbed as the bubble grade rose, then fell again at the very highest grades. The authors read that turn as acoustic shadowing: past a certain point, gas stops brightening the image and starts blocking the sound entirely, leaving a dark void behind it.
The more interesting measures were texture features, which describe how pixel values relate to their neighbors rather than how bright any single pixel is. The team extracted four of them from liver and kidney images: contrast, correlation, homogeneity and energy. These changed significantly with gas burden, and the pattern of change differed by organ.
To test whether those numbers carried real information, the researchers built a logistic regression model that tried to guess, from texture features alone, whether a given scan came from the boat group or the shore group. Because boat scans happened soon after surfacing and shore scans happened hours later, that binary label acts as a rough stand-in for how far along decompression had progressed. They validated it by leaving one animal out at a time and predicting it from the rest. Liver texture features separated the groups with an area under the receiver operating characteristic curve of 0.92, where 0.5 is a coin flip and 1.0 is perfect. Kidney features reached 0.83.
A few limits are worth holding onto. Boat and shore turtles were not the same animals scanned twice; they were different groups compared at different times, so the drop in gas grades is consistent with bubbles resolving over hours but does not prove it for any individual turtle. The turtles that made it to a shore facility may also differ systematically from those scanned at sea. The model was distinguishing two sampling contexts, not diagnosing disease severity against an independent standard. And this is a preprint on bioRxiv, posted without peer review.
Why it matters
Bycatch is one of the largest human pressures on sea turtle populations, and a turtle that swims away from a boat is not necessarily a turtle that survives. Veterinarians already use ultrasound to decide which animals need treatment before release, but that judgment currently rests on a person's read of a grainy image under bad conditions on a moving deck.
Quantitative features offer something a grade cannot: a consistent number that does not drift between operators or between boats. If texture metrics track gas burden reliably, they could eventually support triage decisions, or let researchers compare gas loads across fleets, gear types and haul depths in a way that ordinal grades make awkward.
The organ-specific results also say something about the biology. Gas did not appear and clear the same way in the heart, liver and kidney, which suggests these tissues load and unload gas on different schedules. That is a testable claim, and one that matters for anyone trying to work out how long a rescued turtle should be held before release.
What the paper establishes is feasibility, in the authors' own framing: the features are measurable, they move with gas burden, and they carry enough signal to separate two very different post-surfacing intervals. Turning that into a bedside tool for turtles will take prospective scans of the same animals over time, and validation against outcomes that actually matter, like whether the turtle lives.